Indicator #19: Workers’ Compensation Awards

Workers’ compensation was first implemented in the United States in 1911 in nine states and in subsequent years by all states. This state-based social insurance program was developed to provide guaranteed compensation for workers with work-related injuries or illnesses while limiting the liability exposure of employers. Workers’ compensation provides benefits to partially replace lost wages and pay for medical expenses associated with a work-related injury or illness. In case of a death, the worker’s dependents are eligible for survivor benefits.
There are substantial differences between states in wages and medical costs, in workers’ compensation eligibility, reimbursement, and other administrative regulations governing workers’ compensation. Therefore, differences among states in benefits paid could be due to a variety of factors other than injury and illness incidence. For this reason, this occupational health indicator should be used to monitor trends within states over time rather than to compare states.
Graph
Table
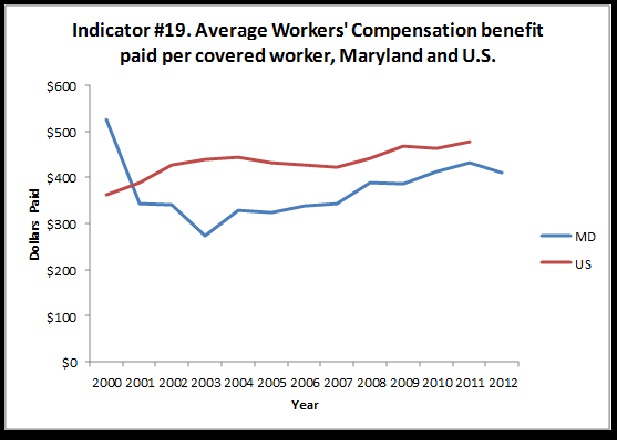
Indicator # 19: Workers Compensation Awards, Maryland
| Year |
Total Amount of workers' compensation benefits paid |
Average amount of workers' compensation paid per covered worker |
| 2000 |
$1,194,629,000 |
$524.65 |
| 2001 |
$787,442,000 |
$343.11 |
| 2002 |
$783,686,000 |
$340.88 |
| 2003 |
$628,510,00 |
$272.55 |
| 2004 |
$767,576,000 |
$329.15 |
| 2005 |
$769,563,000 |
$324.44 |
| 2006 |
$815,351,000 |
$339.02 |
| 2007 |
$830,927,000 |
$343.07 |
| 2008 |
$935,948,000 |
$388.84 |
| 2009 |
$895,905,000 |
$385.17 |
| 2010 |
$953,533,000 |
$412.78 |
2011
2012 |
$1,006,998,000
$970,734,000 |
$432.19
$410.81 |
| 2013 |
$944,612,000 |
$396.23 |
| 2014 |
$955,474,000 |
$397.12 |
| 2015 |
$966,069,000 |
$395.44 |
| 2016 |
$908,180,000 |
$366.65 |
More about this Indicator
Why is this indicator important?
Workers’ compensation awards are reviewed to establish whether the reported medical condition is work-related. Accepted awards represent known work-related injuries and illnesses, and often more severe cases. The total and average amounts of benefits paid estimate the burden of these events, which can help justify prevention programs and activities.
Data Source for this Indicator
National Academy of Social Insurance (total amount and average benefits paid). For more information on this data source, visit: http://www.nasi.org/.
U.S. data and information about this indicator obtained from http://www.cste.org/general/custom.asp?page=OHIndicators
Limitation of Indicator
Workers’ compensation data is not complete, as many individuals with work-related illnesses do not file for workers’ compensation. Self-employed individuals (e.g. farmers, independent contractors and small business owners), corporate executives, domestic and agricultural workers may be exempt from coverage. Additionally, federal employees, railroad, long shore and maritime workers are not covered by state workers’ compensation systems. Compensation award payments are frequently made over time, thus annual awards may not reflect the full cost of, injuries and illnesses for a given year.

